


Data Analytics has become one of the most in-demand career fields for students, freshers, and professionals looking to enter the technology and business world. Companies across industries use data to understand customers, improve operations, increase revenue, and make better business decisions.
For beginners, the biggest challenge is often knowing where to start and what to learn first. There are many tools and technologies available, including Excel, SQL, Python, Power BI, Tableau, and statistics. Learning everything at once can create confusion.
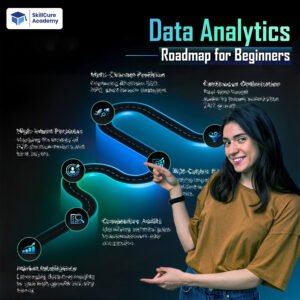
A structured Data Analytics Roadmap for Beginners can help you learn the right skills in the right order and gradually build the confidence needed for an analytics career.
What Is Data Analytics?
Data Analytics is the process of collecting, cleaning, analyzing, and interpreting data to identify useful insights and support better decision-making.
A data analyst may work with sales data, customer information, financial records, website traffic, employee data, or operational reports.
The typical data analytics process includes:
- Collecting data
- Cleaning and preparing data
- Exploring the dataset
- Analyzing trends and patterns
- Creating dashboards and reports
- Communicating insights
- Supporting business decisions
For example, an e-commerce company can analyze customer and sales data to find out which products sell the most, which cities generate the highest revenue, and why customers may stop purchasing.
Why Should Beginners Learn Data Analytics?
Data Analytics offers opportunities across multiple industries, including IT, banking, healthcare, retail, e-commerce, finance, marketing, manufacturing, and consulting.
Some major advantages include:
- Strong demand for analytical skills
- Opportunities for freshers and experienced professionals
- Multiple career paths
- Practical and tool-based learning
- Opportunities to work with different industries
- Scope for career growth and specialization
However, becoming a data analyst requires more than learning one software tool. Beginners should develop a combination of technical, analytical, and communication skills.
Data Analytics Roadmap for Beginners
Here is a practical learning path that beginners can follow.
Step 1: Understand the Basics of Data Analytics
Before learning tools, understand what data analytics actually involves.
Start with fundamental concepts such as:
- What is data?
- Structured vs unstructured data
- Qualitative vs quantitative data
- Data collection
- Data cleaning
- Exploratory data analysis
- Data visualization
- Descriptive and diagnostic analytics
- Business intelligence
- Key Performance Indicators (KPIs)
Understanding these concepts will make it easier to learn technical tools later.
Step 2: Learn Microsoft Excel
Excel is one of the best starting points for beginners because it introduces important concepts such as data cleaning, formulas, calculations, sorting, filtering, and visualization.
Important Excel topics include:
- Basic and advanced formulas
- IF, SUMIF, COUNTIF and related functions
- XLOOKUP and lookup functions
- Pivot Tables
- Pivot Charts
- Conditional Formatting
- Data Validation
- Text and date functions
- Data cleaning
- Excel dashboards
Beginners should not only practice individual formulas. Try creating small projects such as a sales dashboard, employee report, financial report, or customer analysis dashboard.
Step 3: Learn Statistics
Statistics helps analysts understand data and identify meaningful patterns.
You do not necessarily need advanced mathematics to start a Data Analytics career. Focus first on practical statistical concepts.
Important topics include:
| Topic | Why It Matters |
|---|---|
| Mean | Understand average values |
| Median | Analyze central tendency |
| Mode | Identify frequently occurring values |
| Percentage | Compare performance |
| Variance | Understand data spread |
| Standard Deviation | Measure variability |
| Correlation | Understand relationships |
| Probability | Evaluate uncertainty |
| Sampling | Work with representative data |
Learning statistics alongside practical datasets can make these concepts much easier to understand.
Step 4: Learn SQL
SQL is one of the most important skills in the Data Analytics Roadmap for Beginners.
Most organizations store large amounts of business data in databases. SQL allows analysts to retrieve, filter, combine, and summarize this information.
Start with:
- SELECT
- WHERE
- ORDER BY
- GROUP BY
- HAVING
- Aggregate functions
- CASE statements
- Joins
- Subqueries
- Common Table Expressions
- Window functions
- Date functions
For example, a business may ask:
“Which customers generated the highest revenue during the last six months?”
An analyst can use SQL to retrieve and analyze the required information from the company’s database.
Practice SQL regularly using business-oriented problems rather than only memorizing syntax.
Step 5: Learn Data Visualization
Once you can analyze data, you need to communicate your findings clearly.
Data visualization helps transform complex datasets into understandable charts and dashboards.
Learn how to choose appropriate visualizations:
- Bar charts for comparisons
- Line charts for trends
- Pie or doughnut charts for simple proportions
- Scatter plots for relationships
- Tables for detailed information
- KPI cards for important metrics
The goal is not to create dashboards with dozens of charts. The goal is to present the right information in a simple and useful way.
Step 6: Learn Power BI or Tableau
For beginners, learning at least one major Business Intelligence tool is highly valuable.
Power BI is widely used for:
- Data transformation
- Data modeling
- Interactive dashboards
- Business reporting
- KPI tracking
- Data visualization
Important Power BI topics include:
- Power Query
- Data cleaning
- Data modeling
- Relationships
- DAX
- Calculated columns
- Measures
- Filters and slicers
- Interactive dashboards
- Report publishing
You can also learn Tableau if your career goals or target companies require it.
A good beginner approach is to become strong in one visualization platform first rather than trying to master multiple tools simultaneously.
Step 7: Learn Python for Data Analytics
Python is not always the first skill a beginner needs, but it becomes extremely useful as you progress.
Start with Python fundamentals:
- Variables
- Data types
- Conditions
- Loops
- Functions
- Lists and dictionaries
- File handling
Then move toward analytics libraries such as:
- NumPy
- Pandas
- Matplotlib
- Seaborn
Python can help analysts automate repetitive tasks, clean larger datasets, perform analysis, and create visualizations.
Beginners should first become comfortable with Excel and SQL before becoming overly focused on advanced Python programming.
Step 8: Learn Data Cleaning
Real-world datasets are rarely perfect.
You may encounter:
- Missing values
- Duplicate records
- Incorrect formats
- Spelling inconsistencies
- Invalid dates
- Outliers
- Incorrect data types
Data cleaning is therefore a critical part of the analyst’s job.
Learn how to identify problems, determine their causes, and prepare reliable data before analysis.
Step 9: Understand Business Analytics
Technical knowledge alone is not enough.
A good data analyst should understand the business question behind the data.
For example, instead of simply reporting:
“Sales decreased by 12%.”
An analyst should investigate:
- Which products experienced the decline?
- Which regions were affected?
- Did customer demand change?
- Did prices change?
- Was there a seasonal impact?
- Which customer segment contributed to the decline?
This ability to connect data with business problems can significantly improve your effectiveness as an analyst.
Step 10: Build Real-World Projects
Projects are one of the most important parts of the Data Analytics Roadmap for Beginners.
Instead of completing only tutorials, create projects that demonstrate your ability to solve business problems.
Some project ideas include:
- Sales Performance Dashboard
- E-commerce Customer Analysis
- HR Analytics Dashboard
- Marketing Campaign Analysis
- Financial Performance Dashboard
- Customer Churn Analysis
- Retail Store Analysis
- Food Delivery Data Analysis
For each project, try to follow this process:
Business Problem → Data Collection → Data Cleaning → Analysis → Visualization → Insights → Recommendations
This demonstrates how you would approach an actual analytics assignment.
Step 11: Create a Data Analytics Portfolio
A portfolio allows recruiters to see your practical skills.
Your portfolio can include:
| Portfolio Element | What to Include |
|---|---|
| Excel Project | Dashboard and analysis |
| SQL Project | Queries and business questions |
| Power BI Project | Interactive dashboard |
| Python Project | Data cleaning and analysis |
| Project Documentation | Problem, process and insights |
| Resume | Skills, projects and achievements |
You can showcase projects through platforms such as GitHub, LinkedIn, or a personal portfolio website.
Step 12: Prepare for Data Analyst Interviews
After developing your technical skills, start preparing for interviews.
Common interview areas include:
Excel
- Pivot Tables
- Lookup functions
- Conditional formulas
- Data cleaning
- Dashboard creation
SQL
- Joins
- GROUP BY
- HAVING
- Subqueries
- CTEs
- Window functions
- Business-based SQL problems
Power BI
- Power Query
- Data modeling
- DAX
- Measures
- Dashboard design
Statistics
- Mean and median
- Standard deviation
- Correlation
- Probability
- Basic statistical interpretation
HR and Business Questions
- Tell me about yourself.
- Explain one of your analytics projects.
- How did you clean your dataset?
- What insights did you find?
- How would you handle missing data?
- How would you explain a technical finding to a non-technical manager?
Mock interviews and project presentations can help beginners improve both technical knowledge and communication skills.
Data Analytics Roadmap: What Should You Learn First?
A simple learning sequence can look like this:
Data Analytics Fundamentals → Excel → Statistics → SQL → Data Visualization → Power BI → Python → Projects → Portfolio → Interview Preparation
The exact duration depends on your previous experience, learning speed, and practice time.
Common Mistakes Beginners Should Avoid
Many beginners make the mistake of trying to learn every tool at the same time.
Avoid:
- Learning too many tools without practice
- Watching tutorials without creating projects
- Memorizing SQL without solving problems
- Ignoring statistics
- Focusing only on certificates
- Creating dashboards without business context
- Avoiding communication practice
- Applying for jobs without a portfolio
- Expecting advanced skills immediately
Focus on consistent practice and practical application.
Data Analytics Skills Checklist
A beginner preparing for a data analyst role should gradually develop these skills:
- Data Analytics fundamentals
- Excel
- SQL
- Basic statistics
- Data cleaning
- Data visualization
- Power BI or Tableau
- Python basics
- Business understanding
- Problem-solving
- Communication
- Presentation skills
- Portfolio development
How Long Does It Take to Learn Data Analytics?
There is no fixed timeline because every learner has a different background.
A beginner studying consistently can structure their learning approximately like this:
| Learning Stage | Suggested Focus |
|---|---|
| Month 1 | Fundamentals + Excel |
| Month 2 | Statistics + SQL |
| Month 3 | Advanced SQL + Power BI |
| Month 4 | Python + Projects |
| Month 5 | Portfolio + Interview Preparation |
These timelines are flexible. The quality of practice matters more than simply completing a course quickly.
Data Analytics Career Opportunities
After developing the required skills and gaining practical experience, learners can explore roles such as:
- Data Analyst
- Business Analyst
- Business Intelligence Analyst
- Reporting Analyst
- Marketing Analyst
- Financial Analyst
- Operations Analyst
- Product Analyst
The exact role depends on your skills, educational background, industry preference, and experience.
Final Tips for Beginners
Starting a career in Data Analytics does not require learning everything in one day. Build your skills step by step.
Start with the fundamentals, become comfortable with Excel, learn SQL thoroughly, develop visualization skills, understand Power BI, explore Python, and build practical projects.
Most importantly, practice solving real business problems. Employers are interested not only in the tools you know but also in how effectively you use those tools to analyze information and communicate insights.
For learners in Noida and Delhi NCR, joining a practical Data Analytics Course in Noida can also provide structured learning, project experience, mentorship, and interview preparation.
With consistent learning, hands-on practice, and a strong portfolio, beginners can build a solid foundation for a career in Data Analytics.
Frequently Asked Questions
1. Is Data Analytics suitable for beginners?
Yes. Data Analytics can be learned by beginners from different educational and professional backgrounds. Starting with Excel, basic statistics, SQL, and visualization is a practical approach.
2. Which skill should I learn first for Data Analytics?
Excel is a good starting point because it helps beginners understand data manipulation, formulas, reporting, and visualization. After that, SQL and Power BI can be added to the learning path.
3. Do I need Python to become a Data Analyst?
Not necessarily for every entry-level role. Excel, SQL, statistics, and a BI tool are highly important. Python can be learned after developing a strong foundation and can become particularly useful for automation and advanced analysis.
4. How important are projects for a Data Analyst job?
Projects are very important because they demonstrate practical application of your skills. A strong portfolio can show recruiters that you can clean data, analyze it, create dashboards, and communicate useful insights.
5. Can a non-IT student become a Data Analyst?
Yes. Students and professionals from non-IT backgrounds can enter Data Analytics by developing the required technical, analytical, and communication skills. A structured learning plan and regular project practice can make the transition easier.