
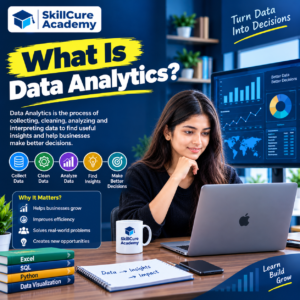

Data analytics is the practice of collecting, cleaning, examining, and interpreting data to find patterns and support better decisions. In practice, it turns raw records such as sales transactions, website clicks, or survey responses into answers to specific questions. Organizations use it to understand past performance, monitor what is happening now, and estimate what is likely to happen next.
What is data analytics?
Raw data on its own has little value. A spreadsheet with a million rows of transactions doesn’t explain why revenue dipped last month. Data analytics adds structure, context, and interpretation. An analyst starts with a question, such as which customers are most likely to cancel a subscription, gathers the relevant data, prepares it, applies statistical or computational methods, and explains the results in terms a decision-maker can act on.
Why data analytics matters
The main value of data analytics is that it replaces guesswork with evidence. It shows what the data actually says, which is useful when intuition and reality disagree. It also helps teams solve problems faster by pinpointing where something went wrong and why. Analytics often reveals opportunities that aren’t obvious from daily work, such as a product that sells well in one region but gets little promotion in another. And it improves efficiency by showing where time, money, or materials are being wasted.
The four types of data analytics
Data analytics is usually grouped into four types, each answering a different question.
- Descriptive analytics answers “What happened?” A monthly sales report is a common example.
- Diagnostic analytics answers “Why did it happen?” It might reveal that a sales drop came from checkout errors on one device type.
- Predictive analytics answers “What is likely to happen?” Forecasting next quarter’s demand is a typical use.
- Prescriptive analytics answers “What should we do?” It recommends actions, such as adjusting staffing or pricing, based on likely outcomes.
In practice these types often build on one another, with description coming first and recommendations last.
How the data analytics process works
- Data collection. Analysts gather data from databases, apps, surveys, sensors, and other sources, then select the parts relevant to the question.
- Data cleaning. They fix errors, handle missing values, and remove duplicates. This step is easy to underestimate, because results built on messy data can look convincing and still be wrong.
- Analysis and interpretation. Using tools such as SQL, Python, R, or Excel, analysts look for patterns, test hypotheses, and check whether differences are meaningful.
- Visualization and communication. Findings become charts, dashboards, or written summaries so decision-makers can understand and act on them.
The steps are rarely strictly linear. Analysis often raises new questions, which send the analyst back to collect or clean more data.
Qualitative and quantitative data analytics
Data analytics methods generally fall into two families. Qualitative analytics works with words, images, and behavior rather than numbers. Common approaches include narrative analysis of interview transcripts or diaries, content analysis of written or spoken material, and grounded theory, which builds an explanation from patterns observed in the data.
Quantitative analytics works with numerical data. Its methods include hypothesis testing to check whether a claim holds up statistically, sample size determination to decide how many observations are needed, and summary measures such as averages and percentages.
Many real projects combine both. A company might use quantitative data to see that customers are leaving at a higher rate, then use qualitative feedback to understand why.
Skills and tools for data analytics
Strong analysts combine technical skills with the ability to explain their findings. The core technical toolkit usually includes SQL for querying databases, Python or R for cleaning data and running statistical tests, Excel or Google Sheets for quick analysis, and visualization tools such as Tableau or Power BI for dashboards. A solid grounding in statistics helps analysts judge whether results are reliable or just noise. Communication matters just as much, since an accurate analysis that no one understands rarely changes a decision.
Real-world examples of data analytics
Data analytics appears across nearly every industry. A retailer might review purchase history to decide which products to restock before a season. A hospital might analyze patient records to find patterns linked to readmissions and focus follow-up care where it’s most needed. A bank might flag transactions that differ sharply from a customer’s usual behavior for fraud review. A farm might compare weather and yield records to guide planting decisions.
Data analytics vs. data science
The two fields overlap, and job titles vary widely between organizations. In general, data analytics focuses on answering specific business questions with existing data, often through reports, dashboards, and statistical summaries. Data science usually goes further, building predictive models, developing new methods, and working with large or unstructured datasets. Many analysts move into data science as their skills grow.
Frequently asked questions
What is data analytics in simple terms?
It is the process of examining data to find useful patterns and answers that help people make better decisions.
What are the four types of data analytics?
Descriptive, diagnostic, predictive, and prescriptive analytics. Each answers a different question, from what happened to what should be done next.
Do I need to know how to code to learn data analytics?
Not to start. Spreadsheet tools cover many basic tasks. However, SQL and at least one programming language such as Python or R are widely used in professional roles, so most analysts learn them over time.
What is the difference between data analysis and data analytics?
Data analysis usually refers to the act of examining and interpreting data. Data analytics is the broader term, covering the full process from collection to communication, along with the tools and methods used.
Which industries use data analytics?
Retail, healthcare, finance, government, manufacturing, agriculture, and many others.