

Data analytics has become one of the most attractive career options for students, freshers, working professionals, and career switchers in 2026. Companies across industries use data to understand customers, improve operations, increase revenue, and make better business decisions.
If you are planning to become a Data Analyst in 2026, the biggest question is not simply “What should I learn?” but “What should I learn first, which tools matter, and how do I become job-ready?”
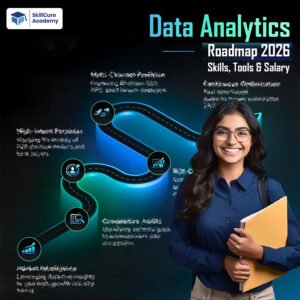
A practical Data Analyst roadmap generally starts with Excel and SQL, moves into business intelligence tools such as Power BI, and then adds Python, statistics, projects, and interview preparation.
What Does a Data Analyst Do?
A Data Analyst works with raw data and converts it into meaningful insights that help businesses make decisions.
Typical responsibilities include:
- Collecting and cleaning data.
- Writing SQL queries to extract information.
- Analysing business and customer data.
- Creating dashboards and reports.
- Identifying trends and patterns.
- Tracking KPIs and business metrics.
- Presenting insights to managers and stakeholders.
- Supporting data-driven business decisions.
A good Data Analyst needs both technical skills and business understanding. Knowing a tool is useful, but being able to explain what the data means is equally important.
Data Analyst Roadmap 2026: Step-by-Step
Here is a practical roadmap that beginners can follow.
| Stage | Skill | Main Tools | Goal |
|---|---|---|---|
| 1 | Data Fundamentals | Excel, Google Sheets | Understand and clean data |
| 2 | SQL | MySQL, PostgreSQL, SQL Server | Extract and analyse data |
| 3 | Data Visualization | Power BI, Tableau | Build dashboards |
| 4 | Statistics | Excel, Python | Understand trends and relationships |
| 5 | Python | Python, Pandas, NumPy | Advanced analysis and automation |
| 6 | Projects | SQL, Python, Power BI | Build a portfolio |
| 7 | Career Preparation | Resume, LinkedIn, Mock Interviews | Become interview-ready |
1. Learn Excel for Data Analysis
Excel is still an important skill for Data Analysts. It is commonly used for quick analysis, reporting, data cleaning, calculations, and business reporting.
Important Excel skills include:
- VLOOKUP and XLOOKUP.
- INDEX-MATCH.
- IF, IFERROR, SUMIF and SUMIFS.
- COUNTIF and COUNTIFS.
- Pivot Tables and Pivot Charts.
- Conditional Formatting.
- Data Cleaning.
- Data Validation.
- Charts and dashboards.
- Power Query.
- Basic statistical calculations.
You should not treat Excel as only a beginner tool. Strong Excel skills can help you understand how business data is structured before moving into SQL and BI tools.
2. Master SQL
SQL is one of the most important technical skills for a Data Analyst.
Companies store large amounts of information inside databases, and SQL allows analysts to retrieve and analyse that information.
Start with:
- SELECT.
- WHERE.
- ORDER BY.
- GROUP BY.
- HAVING.
- Aggregate functions.
- INNER JOIN.
- LEFT JOIN.
- Subqueries.
- CASE statements.
- Common Table Expressions.
- Window Functions.
- Date and time functions.
For interviews, don’t only memorise SQL syntax. Practise solving business problems such as:
“Why did sales decline last month?”
“Which products generated the highest revenue?”
“Who are the top customers by purchase value?”
This type of practice helps you develop analytical thinking along with SQL skills.
3. Learn Power BI or Tableau
After learning how to work with data, you need to learn how to communicate your findings visually.
Power BI and Tableau are popular business intelligence and data visualization platforms. Current India-focused roadmaps frequently recommend learning Power BI or Tableau after building Excel and SQL fundamentals.
For many beginners targeting the Indian market, Power BI is a practical first choice.
Important Power BI skills:
- Power Query.
- Data cleaning and transformation.
- Data modelling.
- Relationships.
- DAX.
- Measures.
- Calculated columns.
- KPIs.
- Slicers and filters.
- Drill-through.
- Interactive dashboards.
- Data storytelling.
Your dashboard should not simply contain attractive charts. It should answer important business questions.
4. Understand Statistics
You do not need advanced mathematics to start a Data Analyst career, but you should understand basic statistics.
Focus on:
- Mean.
- Median.
- Mode.
- Percentage.
- Variance.
- Standard deviation.
- Distribution.
- Correlation.
- Outliers.
- Probability basics.
- Sampling.
- Basic hypothesis testing.
Statistics helps you avoid incorrect conclusions and understand whether a pattern in your data is meaningful.
5. Learn Python for Data Analysis
Python is an extremely useful additional skill for Data Analysts in 2026.
You don’t need to become a software developer. Instead, focus on Python for data analysis and automation.
Important Python libraries include:
- Pandas.
- NumPy.
- Matplotlib.
- Seaborn.
- Jupyter Notebook.
With Python, you can clean large datasets, automate repetitive tasks, perform exploratory data analysis, and create visualizations.
A practical learning sequence is:
Python Basics → Pandas → NumPy → Data Cleaning → EDA → Visualization → Automation.
Python is particularly useful once you are already comfortable with Excel, SQL, and dashboarding.
6. Develop Business and Analytical Thinking
Technical skills alone are not enough.
A Data Analyst should understand the business problem behind the data.
For example, instead of simply saying:
“Sales decreased by 15%.”
A stronger analyst should investigate:
- Which region experienced the decline?
- Which products were affected?
- Did customer demand change?
- Did prices change?
- Was there a seasonal factor?
- Which customer segment contributed to the decline?
This ability to move from numbers to business insights can make a major difference during interviews and in the workplace.
7. Build Real-World Data Analyst Projects
Projects are one of the most important parts of your roadmap.
Instead of completing dozens of small tutorials, build a few strong end-to-end projects.
Project ideas for 2026:
| Project | Tools | Skills Demonstrated |
|---|---|---|
| E-commerce Sales Analysis | Excel, SQL, Power BI | Sales analytics |
| Customer Churn Analysis | SQL, Python, Power BI | Customer analytics |
| Financial Dashboard | Excel, Power BI | Financial analytics |
| HR Analytics Dashboard | SQL, Power BI | HR metrics |
| Marketing Campaign Analysis | Python, Power BI | Marketing analytics |
| Retail Store Analysis | Excel, SQL, Power BI | Business intelligence |
Try to structure each project around a real business question.
Your portfolio should demonstrate that you can clean data, analyse it, visualize it, and explain the insights.
8. Create a Strong Data Analyst Portfolio
Your portfolio should make it easy for a recruiter to understand what you can do.
Include:
- 2–4 strong projects.
- Power BI dashboards.
- SQL case studies.
- Python notebooks.
- Business insights.
- Project descriptions.
- GitHub repositories where appropriate.
- Clear explanations of your contribution.
A certificate can show that you completed a course, but a strong project can demonstrate how you actually apply your skills.
9. Prepare for Data Analyst Interviews
Once your technical foundation is ready, start preparing for interviews.
Common interview areas include:
Excel
- Lookup functions.
- Pivot Tables.
- Data cleaning.
- Excel-based case studies.
SQL
- Joins.
- Aggregations.
- CTEs.
- Subqueries.
- Window functions.
- Business case questions.
Power BI
- DAX.
- Data modelling.
- Relationships.
- Power Query.
- Dashboard design.
Python
- Pandas.
- Data cleaning.
- Basic programming.
- Exploratory Data Analysis.
Business Questions
- KPI analysis.
- Sales analysis.
- Customer behaviour.
- Revenue trends.
- Problem-solving scenarios.
Mock interviews and project presentations can also help improve communication and confidence.
Data Analyst Roadmap 2026: Suggested Timeline
With consistent practice, many current 2026 roadmaps estimate roughly 4–6 months for reaching a job-ready beginner level, although the actual timeline depends heavily on prior experience, study hours, and project quality.
| Month | Focus |
|---|---|
| Month 1 | Excel + Data Fundamentals |
| Month 2 | SQL |
| Month 3 | Power BI + Data Visualization |
| Month 4 | Statistics + Python |
| Month 5 | Advanced Projects + Portfolio |
| Month 6 | Resume + Interviews + Job Applications |
The timeline is flexible. Someone studying full-time may progress faster, while someone learning alongside a job or college may need more time.
Data Analyst Salary in India in 2026
Salary depends on experience, location, company, industry, technical skills, and interview performance.
Recent 2026 sources place fresher and junior Data Analyst salaries broadly around the ₹3.5–₹10 LPA range, while professionals with several years of experience can move considerably higher. These figures should be treated as market ranges rather than guaranteed salaries.
| Experience | Approx. Salary Range in India |
|---|---|
| Fresher / 0–1 year | ₹3.5–₹6 LPA |
| 1–3 years | ₹6–₹10 LPA |
| 3–5 years | ₹10–₹16 LPA |
| 5+ years | ₹16 LPA+ |
Actual compensation can vary significantly between startups, IT services companies, consulting firms, product companies, fintech companies, and MNCs.
Skills such as SQL, Power BI, Python, advanced Excel, business analytics, and strong communication can help candidates compete for better opportunities.
Skills That Can Increase Your Career Growth
After becoming comfortable with the core Data Analyst stack, you can expand into areas such as:
- Advanced SQL.
- Advanced Power BI and DAX.
- Tableau.
- Cloud platforms.
- Data engineering fundamentals.
- Product analytics.
- Marketing analytics.
- Financial analytics.
- A/B testing.
- Generative AI tools for analytics.
- Data automation.
However, avoid trying to learn every technology at once. A strong foundation in Excel + SQL + Power BI + Python + business thinking is more valuable than shallow knowledge of many tools.
Common Mistakes to Avoid
1. Learning Too Many Tools
You don’t need to master ten tools before applying for your first job.
2. Skipping SQL
SQL is a core skill for many Data Analyst roles and is frequently tested during interviews.
3. Focusing Only on Certificates
Certificates can support your profile, but practical projects demonstrate your ability to apply your knowledge.
4. Building Dashboards Without Insights
A dashboard should answer business questions instead of simply displaying charts.
5. Ignoring Communication Skills
Analysts frequently need to explain findings to people who may not have a technical background.
Final Roadmap
If you are starting your Data Analyst journey in 2026, don’t try to learn everything simultaneously.
Follow a structured path:
Excel → SQL → Power BI → Statistics → Python → Projects → Portfolio → Interview Preparation → Job Applications
The most important step is not completing a particular number of courses. It is becoming capable of taking a real dataset, finding useful information, creating meaningful analysis, and communicating your conclusions clearly.
With the right combination of technical skills, practical projects, business understanding, and interview preparation, Data Analytics can provide a strong career path for both technical and non-technical learners in 2026.
Frequently Asked Questions
1. Can I become a Data Analyst in 2026 without a computer science degree?
Yes. Data Analyst roles can be accessible to candidates from commerce, business, economics, science, engineering, and other educational backgrounds. Your practical skills, projects, analytical ability, and interview performance are important factors.
2. How long does it take to become a Data Analyst?
A focused learner can potentially become job-ready in around 4–6 months, although the timeline varies according to previous knowledge and study time. Current 2026 roadmaps commonly suggest several months of consistent learning and project practice.
3. Is Python mandatory for a Data Analyst?
Python is highly valuable, but beginners should first build a strong foundation in Excel, SQL, and data visualization. Python can then expand your analytical and automation capabilities.
4. Which tools should a beginner learn for Data Analytics?
A practical starting stack is Excel, SQL, Power BI, and Python. You can later add Tableau, cloud technologies, advanced statistics, or other specialized tools based on your career goals.
5. What is the salary of a Data Analyst in India in 2026?
Entry-level salaries can broadly fall around ₹3.5–₹6 LPA, while experienced professionals can earn significantly more. Salary depends on experience, company, location, industry, and technical skill level.