
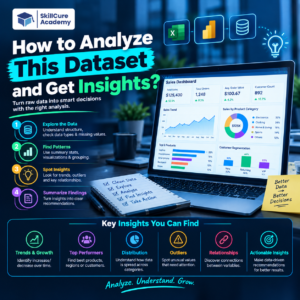

When someone gives you a dataset and asks, “Analyze this dataset and give me insights,” they are not simply asking you to create charts or calculate numbers.
They want to know whether you can understand data, identify patterns, find problems, and convert your findings into useful business insights.
This is one of the most common tasks for a Data Analyst because real-world analytics is about turning raw data into decisions.
What Does Dataset Analysis Mean?
Dataset analysis means examining data to understand what is happening, why it may be happening, and what actions could be considered based on the findings.
A typical analysis involves:
- Understanding the dataset
- Cleaning incorrect or missing data
- Exploring important variables
- Identifying trends and patterns
- Finding unusual values or outliers
- Creating meaningful visualizations
- Comparing different categories
- Communicating actionable insights
For example, imagine an e-commerce dataset containing orders, customers, products, revenue, discounts, and regions.
Instead of simply saying that the company generated ₹50 lakh in revenue, a Data Analyst should investigate questions such as:
- Which products generate the most revenue?
- Which region has the highest sales?
- Are discounts increasing sales?
- Which products have declining performance?
- Which customer segment contributes the most revenue?
These questions turn raw data into meaningful analysis.
Step 1: Understand the Dataset
Before creating charts or writing SQL queries, understand what the dataset actually contains.
Start by checking:
| What to Check | Example |
|---|---|
| Number of rows | 50,000 records |
| Number of columns | 12 variables |
| Data types | Text, number, date |
| Missing values | Customer age missing |
| Duplicate records | Duplicate order IDs |
| Unique values | Product categories |
| Date range | Jan–Dec 2026 |
Understanding the structure helps you decide which analysis techniques are appropriate.
Step 2: Clean the Data
Data cleaning is an important part of analysis because poor-quality data can produce misleading conclusions.
Look for:
- Missing values
- Duplicate records
- Incorrect data types
- Spelling inconsistencies
- Invalid dates
- Negative or impossible values
- Outliers
- Incorrect category names
For example, a dataset may contain:
Delhi, delhi, DELHI, New Delhi
If these values represent the same business region, they should be standardized before calculating regional sales.
Step 3: Perform Exploratory Data Analysis
Once the data is clean, start exploring it.
Exploratory Data Analysis, or EDA, helps you understand the important characteristics of the dataset.
You can calculate:
- Total sales
- Average sales
- Minimum and maximum values
- Number of customers
- Number of orders
- Average order value
- Sales by category
- Sales by region
- Monthly performance
For example:
| Metric | Value |
|---|---|
| Total Sales | ₹50,00,000 |
| Total Orders | 8,500 |
| Customers | 5,200 |
| Average Order Value | ₹588 |
| Top Category | Electronics |
These numbers provide an initial understanding of business performance.
Step 4: Find Trends and Patterns
The next step is to look for patterns.
Suppose monthly sales look like this:
| Month | Sales |
|---|---|
| January | ₹3.2L |
| February | ₹3.5L |
| March | ₹3.8L |
| April | ₹4.1L |
| May | ₹4.7L |
The important insight isn’t simply that May had ₹4.7 lakh in sales.
A stronger observation would be:
“Sales increased consistently from January to May, indicating a positive upward trend during this period.”
This distinction is important in a Data Analyst interview.
Don’t just report numbers. Explain what the numbers mean.
Step 5: Compare Different Segments
Segmentation can reveal insights that overall numbers hide.
You might compare:
- Product categories
- Regions
- Customer types
- Age groups
- Sales channels
- New vs returning customers
- High-value vs low-value customers
For example:
| Region | Revenue | Orders |
|---|---|---|
| North | ₹18L | 2,900 |
| South | ₹14L | 2,400 |
| West | ₹11L | 1,900 |
| East | ₹7L | 1,300 |
Instead of stopping at the table, investigate why the regions perform differently.
A useful analysis might reveal that the North region has both more customers and a higher average order value.
Step 6: Use Visualizations
Charts make patterns easier to understand.
Choose your chart based on the question you want to answer.
| Analysis | Suitable Chart |
|---|---|
| Sales over time | Line chart |
| Category comparison | Bar chart |
| Regional performance | Bar/column chart |
| Distribution | Histogram |
| Relationship between variables | Scatter plot |
| Contribution to total | Donut/Pie chart |
| Geographic performance | Map |
However, don’t create charts just to make a dashboard look attractive.
Every visualization should answer a specific business question.
Step 7: Identify Outliers
Outliers are values that are significantly different from the rest of the data.
For example, if most orders are between ₹500 and ₹5,000 but one order is ₹5,00,000, investigate it.
The value could represent:
- A genuine high-value customer
- A bulk order
- A data-entry mistake
- A duplicate transaction
- A special business transaction
Never automatically delete an outlier.
Investigate it first.
Step 8: Convert Findings Into Business Insights
This is where a Data Analyst adds real value.
Consider this observation:
Finding: Product A generated the highest number of orders.
That’s useful, but it isn’t necessarily a complete insight.
A deeper analysis could reveal:
Insight: Product A generated the highest number of orders, but Product B generated higher revenue because its average selling price was significantly higher.
Now the business has something meaningful to consider.
Difference Between Data, Finding, and Insight
| Level | Example |
|---|---|
| Data | Product A received 5,000 orders |
| Finding | Product A had the highest order volume |
| Insight | Product A drives order volume, while Product B contributes more revenue per order |
This is the kind of thinking employers look for in Data Analyst interviews.
Step 9: Ask “Why?”
Good analysis doesn’t stop at what happened.
Try to investigate:
What happened? → Why did it happen? → What can we do about it?
For example:
What happened?
Sales decreased by 15% in one region.
Why?
Further analysis shows that the number of new customers decreased significantly.
What can be considered?
The business could investigate customer acquisition, marketing performance, pricing, and competitor activity in that region.
Notice that the analyst is using data to identify areas for further action rather than making unsupported assumptions.
Step 10: Present Your Final Insights
When presenting your analysis, keep the final output simple and business-focused.
A good insight summary can include:
- Key finding
- Supporting data
- Possible reason
- Business implication
- Recommended area for action
For example:
“Online sales increased steadily during the analyzed period, with the highest revenue recorded in May. Electronics contributed a significant portion of total revenue, while the North region recorded the highest sales. Further analysis should focus on the factors driving regional and category-level differences.”
Tools You Can Use
Different tools can be used depending on the size and complexity of the dataset.
- Excel – cleaning, formulas, PivotTables, charts, and basic analysis
- SQL – querying and analyzing database records
- Python – advanced data cleaning, EDA, and automation
- Power BI – interactive dashboards and business reporting
- Tableau – data visualization and dashboarding
A Data Analyst does not need to use every tool for every dataset.
The important thing is choosing the right tool for the problem.
How to Explain Dataset Analysis in an Interview
If an interviewer gives you a dataset and asks you to analyze it, don’t immediately start creating charts.
Explain your approach:
“First, I would understand the business objective and the structure of the dataset. Then I would check data quality, clean missing or duplicate records, perform exploratory analysis, identify trends and outliers, segment the data, and create visualizations. Finally, I would convert the findings into actionable business insights and clearly communicate them to stakeholders.”
This shows that you understand the complete analytics process, not just individual tools.
Final Takeaway
Analyzing a dataset is much more than calculating totals and creating dashboards.
A strong Data Analyst can take raw data → clean data → analysis → findings → insights → business decisions.
When you work on a dataset, always ask:
- What is the business problem?
- What does the data contain?
- Is the data reliable?
- What patterns can I find?
- Are there unusual values?
- Which segments are performing differently?
- Why might these differences exist?
- What does the business need to know?
- How can I communicate the findings clearly?
The goal of data analysis is not to show how many numbers you can calculate. The goal is to use data to answer meaningful questions.
FAQs
1. What should I do first when analyzing a dataset?
First, understand the business objective and dataset structure. Then check data types, missing values, duplicates, and data quality before starting detailed analysis.
2. What are the most important things to look for in a dataset?
Look for trends, patterns, relationships, outliers, missing values, category differences, and changes over time.
3. Which tools are commonly used for dataset analysis?
Excel, SQL, Python, Power BI, and Tableau are commonly used depending on the dataset and business requirement.
4. How do I turn data findings into insights?
Don’t stop at describing the numbers. Explain what the finding means, investigate possible reasons, and identify its potential business impact.
5. Is dataset analysis important for Data Analyst interviews?
Yes. Dataset-based tasks can demonstrate your ability to clean data, analyze information, identify patterns, use analytical tools, and communicate business insights.