

A Data Analytics project is one of the most important things you may discuss during a data analyst interview. Interviewers are not only interested in knowing what project you completed. They also want to understand how you think, how you work with data, which tools you use, and whether you can turn data into useful business insights.
A good project explanation should be clear, structured, and focused on your contribution. Instead of explaining every technical detail, show the interviewer how you approached the problem and what you learned from the data.
1. Start With the Project Overview
Begin with a short introduction about your project.
Tell the interviewer:
- What was the project about?
- What business problem were you solving?
- What type of data did you use?
- What was your role in the project?
For example:
“I worked on a sales analytics project where my goal was to analyze sales performance, identify top-performing products, and understand factors affecting revenue.”
Keep this introduction short. You can explain the technical details when the interviewer asks further questions.
2. Explain the Business Problem
After introducing your project, explain why the project was needed.
A Data Analyst does not simply create charts or write SQL queries. The purpose of analysis is to solve a business problem.
For example:
| Business Problem | Analytics Question |
|---|---|
| Sales are declining | Which products or regions are responsible? |
| Customer retention is low | Which customers are likely to leave? |
| Marketing costs are increasing | Which campaigns generate better results? |
| Inventory is increasing | Which products are selling slowly? |
This shows that you understand the connection between data and business decisions.
3. Explain Your Dataset
Next, briefly explain the data you worked with.
You can mention:
- Number of rows and columns
- Important fields
- Data source
- Time period
- Types of data
- Any major data-quality problems
For example:
“The dataset contained around 50,000 sales records with columns such as order date, customer ID, product category, region, quantity, sales, and profit.”
You don’t need to explain every column. Focus on the fields that were important for your analysis.
4. Explain How You Cleaned the Data
Data cleaning is an important part of almost every analytics project.
Explain what problems you found and how you handled them.
Common data-cleaning activities include:
- Removing duplicate records
- Handling missing values
- Correcting incorrect data types
- Standardizing names and categories
- Identifying outliers
- Removing unnecessary columns
- Checking inconsistent values
For example:
“During data cleaning, I found duplicate records and missing values in some fields. I removed duplicate entries, handled missing values based on their business context, and standardized category names before starting the analysis.”
This demonstrates practical data-handling skills.
5. Explain the Tools You Used
Clearly mention the tools you used in the project and explain why you used them.
| Tool | Possible Use |
|---|---|
| Excel | Data cleaning, formulas and basic analysis |
| SQL | Data extraction, filtering and aggregation |
| Python | Data cleaning and advanced analysis |
| Power BI | Dashboard creation and visualization |
| Tableau | Interactive dashboards and reporting |
For example:
“I used SQL to extract and aggregate the required data, Excel for some initial data validation, and Power BI to create an interactive dashboard.”
Don’t simply list tools. Explain how each tool contributed to the project.
6. Explain Your Analysis
This is where you explain what you actually did with the data.
For example, you might have:
- Compared monthly sales
- Analyzed regional performance
- Identified top-selling products
- Calculated profit margins
- Studied customer behavior
- Compared actual vs target performance
- Identified trends and patterns
You can explain your analysis using a simple flow:
Data → Cleaning → Analysis → Visualization → Insights
This makes your explanation easy for the interviewer to follow.
7. Talk About Your Key Insights
One of the most important parts of your project explanation is the insights you discovered.
Don’t just say:
“I created a dashboard.”
Instead, explain what the dashboard helped you discover.
For example:
“The analysis showed that although one product category generated high sales, its profit margin was comparatively low. This indicated that high revenue did not necessarily mean high profitability.”
A strong Data Analyst project explanation connects the analysis to a meaningful business insight.
8. Explain Your Dashboard
If you created a Power BI or Tableau dashboard, explain its purpose rather than describing every visual.
You can mention:
- Key KPIs
- Important charts
- Filters and slicers
- Trends shown
- Business questions answered
For example:
“I created a Power BI dashboard showing total sales, profit, order quantity, monthly sales trends, regional performance, and product-level performance. Users could filter the dashboard by region, category, and time period.”
This gives the interviewer an understanding of how your dashboard works.
9. Explain Your Role Clearly
If the project was completed as part of a team, be honest about what you personally worked on.
You can say:
“The project was completed by a team of three. My responsibility was data cleaning, SQL analysis, and creating the Power BI dashboard.”
Avoid claiming responsibility for work that you did not perform.
Interviewers may ask detailed follow-up questions based on your answer, so you should be comfortable explaining every part of your contribution.
10. Explain the Challenges You Faced
Talking about challenges can make your project explanation more realistic.
For example:
- Missing data
- Duplicate records
- Inconsistent categories
- Large datasets
- Incorrect dates
- Slow SQL queries
- Difficulty selecting the right KPIs
- Conflicting business requirements
Then explain how you solved the problem.
A useful format is:
Problem → Approach → Solution → Result
For example:
“The dataset contained inconsistent product names. I standardized the names during the cleaning process so that the same products were not treated as separate categories during analysis.”
11. Explain the Project Outcome
End your project explanation by discussing the outcome.
Depending on your project, the outcome could be:
- Identified sales trends
- Improved reporting
- Found high-performing products
- Identified low-performing regions
- Reduced manual reporting
- Created an automated dashboard
- Provided actionable business insights
If you have a measurable result, mention it.
For example:
“The dashboard reduced the need for manually preparing weekly sales reports and made it easier to compare regional performance.”
Don’t invent numbers just to make your project sound impressive. Use measurable results only when you actually have them.
A Simple Framework to Remember
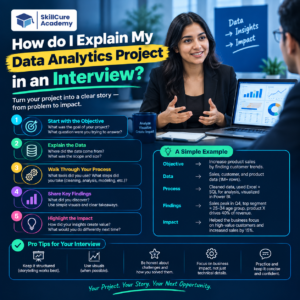
You can use the 6-step framework below whenever an interviewer asks, “Tell me about your project.”
| Step | What to Explain |
|---|---|
| 1. Problem | What business problem were you solving? |
| 2. Data | What data did you use? |
| 3. Cleaning | How did you prepare the data? |
| 4. Analysis | What analysis did you perform? |
| 5. Insights | What did you discover? |
| 6. Outcome | How did your analysis help? |
This structure prevents your answer from becoming too technical or unorganized.
Sample Interview Answer
Here is an example of how you can explain a Data Analytics project:
“I worked on a sales analytics project to understand sales and profitability across different products and regions. I used a sales dataset containing information such as order date, product category, region, quantity, sales, and profit.
First, I cleaned the data by removing duplicates, handling missing values, and standardizing inconsistent categories. Then I used SQL to analyze sales performance and identify trends across products and regions.
After completing the analysis, I created a Power BI dashboard with KPIs and interactive visualizations for sales, profit, product performance, and regional performance. One of the key insights was that some products generated high revenue but had relatively low profitability.
The final dashboard made it easier to monitor performance and identify areas that required further attention. Through this project, I improved my skills in SQL, data cleaning, data visualization, and communicating business insights.”
Common Mistakes to Avoid
Many candidates have good projects but struggle to explain them effectively.
Avoid these mistakes:
- ❌ Explaining only the tools you used
- ❌ Reading the project description like a script
- ❌ Claiming work you did not perform
- ❌ Using too much technical jargon
- ❌ Giving insights without explaining how you found them
- ❌ Saying “I made a dashboard” without explaining its purpose
- ❌ Memorizing an answer word-for-word
- ❌ Inventing business results or percentages
Instead, focus on your problem-solving process.
How to Make Your Project Explanation Stronger
Before an interview, prepare answers to these questions:
- What was the objective of your project?
- Where did the data come from?
- How many rows and columns did it have?
- What data-cleaning problems did you find?
- Which tools did you use?
- Why did you choose those tools?
- What analysis did you perform?
- What were your top three insights?
- What challenges did you face?
- What was the final outcome?
- What would you improve if you did the project again?
- What did you personally contribute?
If you can answer these questions confidently, you will be much better prepared for project-related interview questions.
Final Takeaway
Explaining a Data Analytics project in an interview is not about describing every formula, SQL query, or chart. It is about showing the interviewer how you approached a real problem using data.
Follow a simple structure:
Problem → Data → Cleaning → Analysis → Insights → Outcome
Keep your explanation practical, be honest about your contribution, and focus on the business value of your analysis. A well-explained project can demonstrate your technical skills as well as your ability to communicate insights clearly.
FAQs
1. How long should I explain my Data Analytics project in an interview?
Start with a concise explanation of around 1–2 minutes. If the interviewer wants more detail, expand on the technical aspects, challenges, or insights.
2. Which tools should I mention in my Data Analytics project?
Mention the tools you actually used, such as Excel, SQL, Python, Power BI, or Tableau. More importantly, explain what you used each tool for.
3. What if my Data Analytics project is a personal project?
That’s completely fine. Explain the project honestly and focus on the problem, dataset, analysis, insights, and what you learned from the project.
4. Should I memorize my project explanation?
It’s better to understand your project rather than memorize a fixed answer. Interviewers may ask follow-up questions, so you should be able to explain your decisions naturally.
5. What is the most important part of explaining a Data Analytics project?
Your problem-solving process and business insights are especially important. Show how you moved from raw data to analysis and then to useful conclusions.